What is this about?
Open with an accurate title and a concise overview. Place units, timeframe, population, and sources beside important numbers.
 Triuna LabsNeed a custom workflow?
Open agent skill · Content and information design
Help people get the overview, find the detail they need, and understand what it means. S2C is a practical workflow for dense websites, articles, and infographics.
The free page audit accepts public HTTPS URLs and local HTML, then returns a dated report. Public URLs can include desktop and mobile captures, actionable callouts, adjustable checks and lens-specific evidence. Review our Privacy Policy and Terms of Service.
Live visual audit · free beta
Capture desktop and mobile layouts, follow numbered callouts, and review suggested changes beside the page. Switch between people, robots, agents and accessibility lenses; inspect AX and Tab paths; tune the rubric or supply a visitor task. The element overlay is a transparent heuristic, not measured eye tracking. Shared browser allowance is capped; source-only audits remain available when capture is busy.
Reproducible page fixture
The fictional Meadow School page inserts a sibling-program heading and link after page load, then changes its description and canonical URL. A corrected page exposes the same route in its initial HTML. The open audit compares headings, links, text blocks, and metadata, and keeps the raw response with a digest for replay. A bounded site graph shows how the rendered home-page link shortens the possible route to the sibling page.
A difference is a review candidate, not proof that Google cannot render the page. The demo includes a deliberately broken link so the report can show an actionable page check. Explore the audit walkthrough ↗ · Run the audit locally ↗
Local tool · v0.15.0
The browser audit accepts one public HTTPS URL or local HTML and produces a visual report or source-only checks. The open local playground also it accepts one public URL or one self-contained HTML prototype and produces a dated visual report, editable scoring revisions, and a versioned JSON result with action candidates. Public URL capture respects robots refusals and constrains browser resources to pinned, public-IP, same-origin GET responses; this can change how a page renders. HTML prototypes run with scripts and external requests blocked.
python playground/server.py --port 8787
# Open http://127.0.0.1:8787/ on your own computer
A local stdio MCP adapter calls the same runner. An explicit role scenario can compare a route, required headings, and a captured action against the bounded site graph. The fictional parent example checks a sibling-schedule path; it does not claim to measure a parent's behavior. Read the API, MCP, and journey contract ↗ · Inspect the synthetic scenario ↗
Local HTML stays on your device. Public URL HTML is fetched transiently and analyzed in your browser without application storage. The hosted visual beta uses a bounded, shared browser allowance. Accounts, subscriptions and whole-site crawling are not offered in this beta.
The reader's route
Open with an accurate title and a concise overview. Place units, timeframe, population, and sources beside important numbers.
Use descriptive headings, labels, and grouping so the outline works as a map, including on mobile and with assistive technology.
Keep the explanation and caveats next to the fact or visual. Let interested readers follow the evidence into depth.
Eye-tracking pattern map
NN/g describes several scanning behaviors. The likely route changes with the task, layout, and reader motivation. S2C makes each route useful without pretending to control where an eye will land.
With little structure, attention often favors the top and beginnings of lines. Lead with meaningful words, then add useful headings and groups.
Readers scan headings and enter the section that matches their question. Make the heading-only outline accurate and descriptive.
Task-relevant words, links, digits, and selective emphasis can become search anchors. Label them clearly and keep their context nearby.
Readers may sweep across comparison cells and back along the next row. Keep headers available, explain jargon, and make cells interpretable.
Apply it where information is dense
Clarify page purpose, navigation, metric labels, and the path from a summary to supporting detail.
Make headings tell the story, then keep methods, definitions, examples, and qualifications available for close reading.
State the takeaway, label comparisons and units directly, and provide a text equivalent for the essential message.
Worked Triuna Labs blueprint
The supplied Triuna Labs example is most useful as a content plan: product names and status support targeted finding; shared fields support comparison; research summaries lead into methods and limits. These are design hypotheses to verify with readers.
| Section | Reader question | Scan support | Close-read path |
|---|---|---|---|
| Navigation | Where do I go? | Distinct Products, Tools, Articles, and Consulting labels | Destination pages explain each area |
| Products | Which product fits my task? | Names, purposes, and availability in a consistent order | Direct product pages with details |
| Frameworks | Which method addresses my problem? | Descriptive category headings and links | Scope, maturity, and documentation |
| Research | What was found, and how? | Finding-led title and compact summary | Methods, caveats, and reproducibility links |
| Consulting | What work can Triuna Labs do? | Clear service headings and next step | Scope, deliverables, and contact route |
A comparison table helps only when the items genuinely share fields. Cards can work better for unlike modules; mobile reading order still needs checking.
A small example
The same facts become easier to locate when the section title answers a question and the numbers carry their context.
Results
2025: 42. 2026: 57. A significant change.
Illustrative numbers, not a Triuna Labs study result.
Inspect, then test
The open HTML and Markdown audit now returns source-backed strengths, weaknesses, suggested fixes, and an experimental 0–100 structural friction risk index. It works on a local file, an explicitly supplied public URL, or staged files. The index uses transparent editorial weights and has low confidence; it is not a measured cognitive-load or comprehension score. It is separate from the web-performance metric Cumulative Layout Shift (CLS). Generate a visual page report →
Check headings, link labels, image alternatives, and table headers in the source.
Use the versioned risk index to triage flagged structure, with each point contribution visible.
Inspect rendered desktop and mobile views, then ask readers to find and explain an answer.
Optional live-page observations: On a page you control, a small first-party script can record section viewport exposure, mouse hover, clicks, and taps after an explicit start. The report presents those browser signals separately from predicted attention and reader comprehension. It uses no camera and sends nothing by default. See the integration and limits ↗
Full multi-lens case study · presentation updated October 31, 2026
Walk a scrollable desktop or 440 × 956 mobile capture with numbered findings, a draggable minimap, configurable rule checks, user-story evidence, and saved accessibility and keyboard paths. People, Robots, Agents and Accessibility each have their own workflow and evidence limits. Improvements come first; positive evidence is collapsed.
The Robots lens includes a sourced planner for search discovery, AI training, previews and private access. Planner choices are guidance, not live policy verification. Audit evidence and each capture retain their original dates.
Rendered-page case study
Audited October 26, 2026. We checked whether a candidate can understand the product and inspect proof before joining the waitlist. The report places numbered observations beside captured desktop and mobile views: a visible résumé example and grouped inputs are strengths; the sample studio state and numeric role-fit signals deserve clearer labels. These are review hypotheses, not recorded eye movements or measured comprehension.
The same workflow can review another public page with a stated reader task, dated captures, and a separate source audit.
Browser-reported reading and keyboard paths
We captured JobFitIQ in Chromium on October 26, 2026 at desktop, 375 px mobile, and 320 px reflow widths. The report places numbered accessibility-tree and Tab paths over the page, with complete step lists and review candidates. On desktop the first heading appears at reading step 12 after navigation; on mobile it appears at step 4. The 320 px snapshot showed no document-level horizontal overflow.
Two small keyboard targets on the desktop capture need a spacing and exception review. This is a browser projection, not a screen-reader recording or WCAG conformance audit. Open the self-contained assistive report ↗ · Read the capture method ↗
Experimental visual layer · v0.9.0
Using the dated JobFitIQ capture, S2C combines visible element position, size, font size, approximate color contrast, and element type into a relative heatmap. The report lets you switch the overlay on and off and inspect the highest-weighted cues on desktop and mobile.
A separate WCAG text contrast spot check screens captured solid colors. The sampled colors suggest the small feature keywords deserve verification against the live CSS; that is not a conformance finding. Contrast is a continuous heatmap input, and the held-out UEyes webpage test found just a 0.005 NSS difference against a no-contrast version at 3 seconds.
The weights are editorial and were not fitted to gaze data. On 27 held-out UEyes webpages at 3 seconds, this fixed map scored 0.506 NSS versus 1.148 for a Train-fitted position-only map; it did not beat that simple baseline. The colors are relative to each screenshot and do not report personal gaze, reading time, or comprehension.
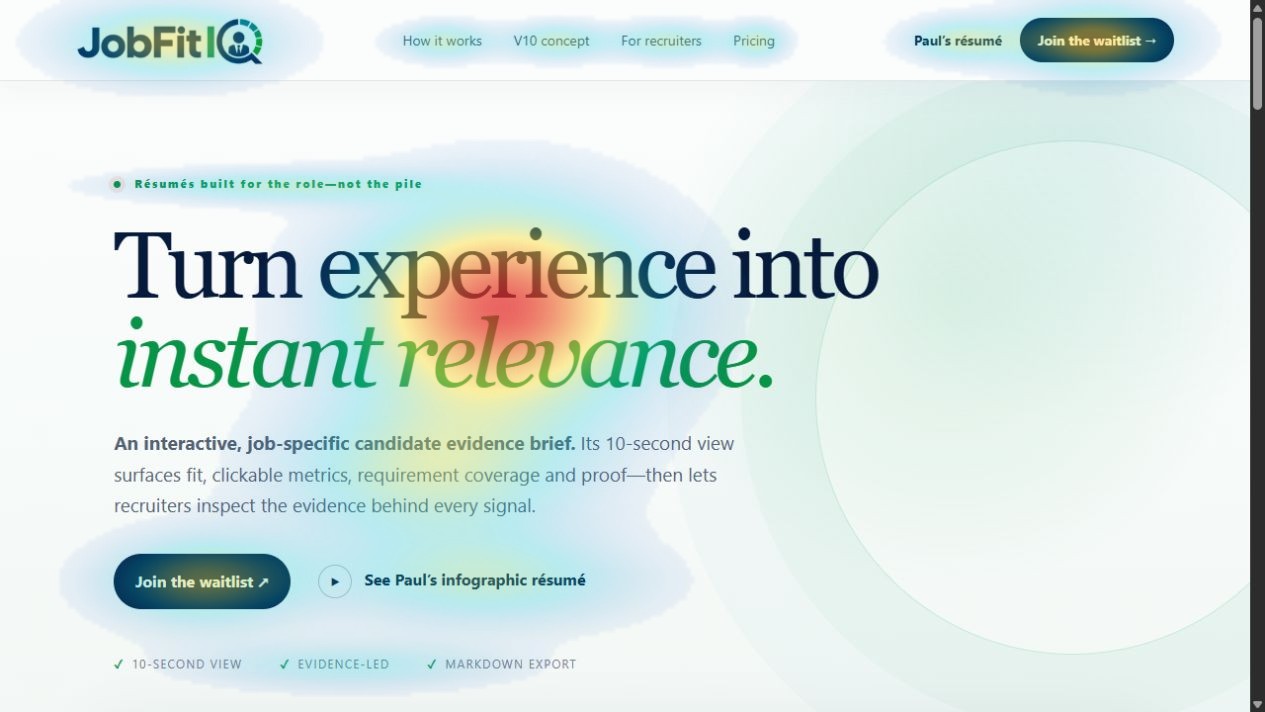
Open the interactive HTML report ↗ · Inspect the method and held-out result ↗
Research to page audit
AGD studied where people looked during five-second free viewing of webpage images. S2C uses that work to inspect how layout and visible components compete, then checks the reader's actual task separately. The JobFitIQ example shows the difference.
Capture the viewport and name the evidence or action the reader needs. Mark the visible text, imagery, branding, and controls.
Inspect the estimated heatmap as an untrained design hypothesis. Keep predicted attention separate from a claim about a person's fixations.
Ask readers to find the résumé example and explain the product before joining a waitlist. Record their result, not just where a heatmap glows.
Read the AGD-to-audit guide and worked JobFitIQ question ↗ · Read the research paper ↗
Evidence
Eye-tracking research describes several scanning patterns; task and content affect which one a reader uses. S2C turns that evidence into design questions, not a formula for forcing attention or a numerical comprehension score.
Infographic reading research
A tested zigzag infographic helped comprehension in one study, while NN/g found decorative zigzag web rows slowed scanning in another. The medium, material, and reader task matter more than a universal layout rule.
Compared layouts of two infographic stories using gaze and pupil measures. The tested zigzag form had higher comprehension and lower reported load; the paper gives no universal pixel-distance rule.
Higher-comprehension readers in a 95-student study made more transitions between words and graphics. A source audit cannot observe those transitions.
Computational attention research
Visual-attention and gaze-estimation systems answer different research questions. The S2C skill cites them to set a research boundary, not to claim that its layouts were optimized by a model.
Predicts fixation-density maps and scanpaths for free viewing of graphic designs using component-aware features. Free-viewing attention differs from task success.
Generates synthetic text scanpaths for downstream NLP experiments. It is not a website layout engine.
Combines gaze tracking and language-model context to track linear and jump reading. It does not validate an S2C design.
Explores on-device gaze estimation in a browser. S2C does not use it; the optional section probe uses no camera.
Element-attention research track: We are studying whether existing gaze records and UI element boxes can support calibrated, task-specific estimates on unseen pages. The experimental heatmap is an evaluated but uncalibrated layout heuristic; on held-out UEyes webpages it trailed a Train-fitted position-only map. It is not a gaze measurement. Read the dataset join and validation plan ↗